
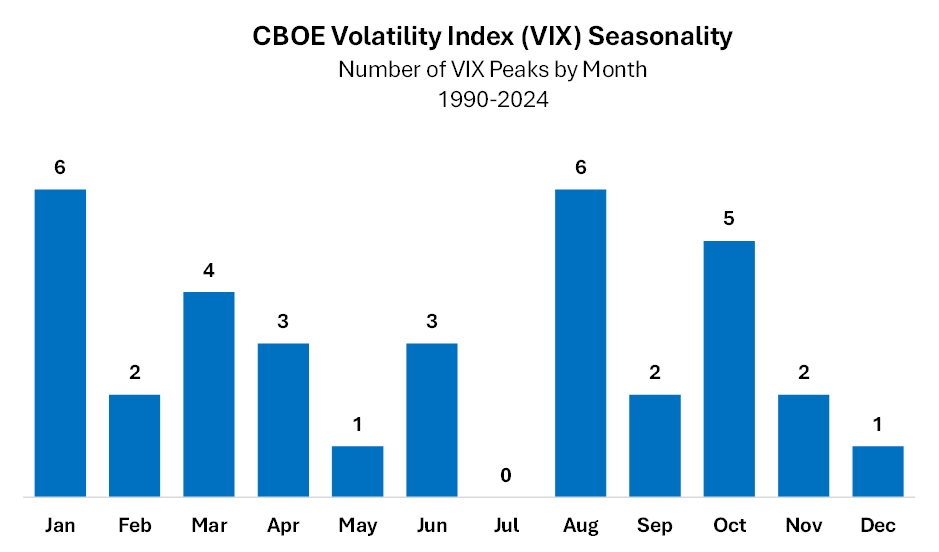
We are almost through what is typically one of the quietest months of the year for US equity volatility (July), with two consistently choppy months ahead (August and October). The VIX peaked in 2025 at 52.3 in early April, a four-standard deviation move, mainly due to the trade wars.
Source: RiskBridge, DataTrek
The VIX level and U.S. large cap stocks are inversely correlated, so the broad stock market index may come under pressure between now and October.
Historically, when the VIX peaks in August or October, the S&P mostly ends the year higher.
The VIX peaked in August 1990, 2002, 2015, 2011, 2017, and 2024. The S&P was up an average of +4.2% by the end of those years.
The VIX peaked in October 1992, 1995, 1997, 1998, and 2014. By the end of those years, the S&P was up an average of +23.9 %.
Based on our analysis, U.S. stocks may experience incremental volatility through October due to seasonal trends, trade tariffs, immigration policy, and Fed policy uncertainty. With the S&P 500 Index up 7.2% YTD, the market has much higher odds of peaking later this year than this month.
DISCLOSURE:
Investment Advisory Services offered through RiskBridge Advisors, LLC d/b/a Finley Davis Private Wealth (“RiskBridge”) (RB) or Lion Street Advisors, LLC (LSA),registered investment advisers with the SEC. Registration does not imply a certain level of skill or training. Securities offered through Lion Street Financial, LLC (LSF), member FINRA & SIPC, through Finley Davis Financial Group, Inc. (FDFG). RB and FDFG are not affiliated with LSA or LSF.
The opinions / strategies above are for general information only, are not intended to provide specific advice or recommendations for any individual and may not reflect those of Lion Street Financial LLC. Diversification does not guarantee profit or protect against loss. Investing internationally carries additional risks such as differences in financial reporting, currency exchange risk, as well as economic and political risk unique to the specific country. This may result in greater share price volatility. Shares, when sold, may be worth more or less than their original cost.
Past performance has no guarantee of future results. Personnel of RiskBridge Advisors, LLC (“RiskBridge”) prepared the Risk Report. The views expressed herein do not constitute research, investment advice, or trade recommendations. RiskBridge may, from time to time, participate or invest in transactions with issuers of securities that participate in the markets referred to herein, perform services for or solicit business from such issuers, and/or have a position or effect transactions in the securities or derivatives thereof.
All references to index funds and other economic indicators are provided for illustrative purposes only. Investors cannot invest in an index, and indexes do not reflect the deduction of advisors’ fees or other trading expenses.
Information about benchmark indices is provided to allow you to compare them to the performance of RiskBridge portfolios. Investors often use these well-known and widely recognized indices as one way to gauge the investment performance of an investment manager’s strategy compared to investment sectors that correspond to the strategy. However, RiskBridge’s investment strategies are actively managed and not intended to replicate the performance of the indices: the performance and volatility of RiskBridge’s investment strategies may differ materially from the performance and volatility of their benchmark indices, and their holdings will differ significantly from the securities that comprise the indices. You cannot invest directly in indices that do not take into account trading commissions and costs. Net total return indices reinvest dividends after the deduction of withholding taxes, using (for international indices) a tax rate applicable to non-resident institutional investors who do not benefit from double taxation treaties.
The Cboe Volatility Index® (VIX® Index) is a financial benchmark designed to provide an up-to-the-minute market estimate of the S&P 500 Index’s expected volatility. It is calculated by using the midpoint of real-time S&P 500® Index (SPX) option bid/ask quotes. More specifically, the VIX Index is intended to provide an instantaneous measure of how much the market thinks the S&P 500 Index will fluctuate in the 30 days from the time of each tick of the VIX Index.
This Risk Report is distributed for informational purposes only. All material presented is compiled from sources believed to be reliable, but accuracy cannot be guaranteed, and RiskBridge makes no representation as to its accuracy or completeness. Any opinions, recommendations, and assumptions included in this material are based upon current market conditions, reflect the judgment of RiskBridge as of the date indicated, and are subject to change without notice. You acknowledge and agree that RiskBridge is not obligated to provide any additional information or update such information in making the information available. Securities and/or indices highlighted or discussed in this communication are mentioned for illustrative purposes only and should not be construed as investment recommendations. All investments involve risk, including the loss of principal. Before implementing any strategy, consult with a qualified financial adviser and/or tax professional. Risk Report and this information are not intended to provide investment, tax, or legal advice, and this material is not to be relied upon in substitution for the exercise of independent judgment. This Risk Report is not to be reproduced, in whole or part, without the written consent of RiskBridge.